

Parkrose Culture Survey
Parkrose: Heart, Hope, and Honest Feedback
From November 2024 - June 2025 we surveyed the Parkrose Community about how they feel about our Business District and Neighborhood. While we got a lot of submissions, the demographics were all from similar
-
75% White
83% College Educated
97% English-speaking
62% Women
85% Residents 5+ years -
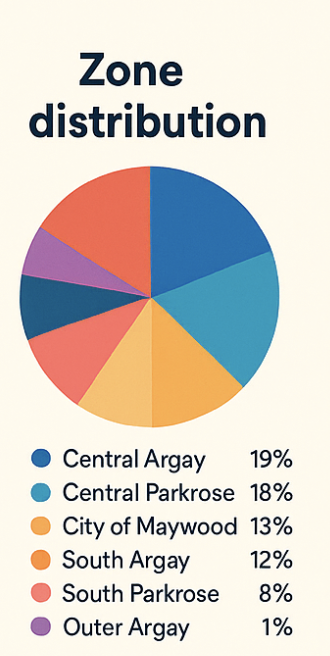
The responses came from all corners of our district:
Central Argay (19%)
Central Parkrose (18%)
City of Maywood (13%)

From November 2024 - June 2025 we surveyed the Parkrose Community about how they feel about our Business District and Neighborhood. Here are the results of the Parkrose area resident survey insights.

We Love Parkrose
Mountain views
The vibrant, diverse community
It is still affordable, compared to other districts in Portland
Proximity to work, nature, and family
We Need More
“Parkrose needs improved access to fresh food. Healthy neighborhoods are not food deserts.”
“Parkrose needs more local/walkable coffee shops, breakfast places, a library, other family friendly business. Even more food carts would be nice.”

-
The emotional pulse is a bit low-energy. Parkrose was hit hard in the pandemic and we are still recovering. However, the future looks bright:
41% feel sad, but
33% feel happy, and
Only 8% feel angry—
Parkrose is known for its resilience and this survey shows people are just waiting for a spark.
-
Routines scored only 2.0/5
Sidewalks—a consistent concern—scored 2.8/5

SO WHAT IS The Takeaway?
Parkrose residents want to stay, connect, and feel safer doing it.
WHAT DOES PARKROSE Want?
Safer sidewalks and crossings
More welcoming, walkable spaces
Coffee shops, bakeries, and family-friendly spots that aren’t just lottery bars
A local grocery store with real produce
Places where people can meet that don’t cost an arm and a latte